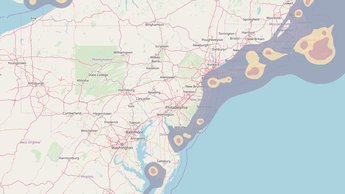
Maps Show Migration Patterns and Habitats of Diving Birds
In partnership with the U.S. Fish & Wildlife Service
(USFWS) and the Bureau of Ocean Energy Management (BOEM), nine new map layers
showing the core use areas of three diving bird species – the northern gannet,
red-throated loon, and surf scoter – during spring migration, fall migration
and winter, have been published on the Portal. The maps can be found by
clicking on the Bird Seasonal Migration and Utilization Distribution dropdown
in the Portal’s Marine Life theme.

These new layers represent some of the results of a study to determine fine-scale use and movement patterns over the course of five years (2012-16) for the three species in federal waters of the Mid-Atlantic. To accomplish the study, scientists fitted over 400 birds with a device that tracked movements over a period of time. These species are each found in relatively large numbers and represent a cross-section of marine birds within Mid-Atlantic waters during this time period. The birds are all considered species of conservation concern and also exhibit traits that may make them vulnerable to the adverse effects of offshore wind development. For more detailed information about the study, read the report to the BOEM Environmental Studies Program.
The new data products and their underlying data differ from other marine life data available on the Portal. Results provide different, but often complementary, information on distribution and movement patterns. Movement data generally provide finer-scale spatial and temporal information that enable correlations to be made between locations and habitat use, and provide insights on migratory routes timing and key use areas (foraging, resting, breeding). They are also not bound to a particular survey area, but are derived from all locations used by tagged individuals. Survey-derived, predictive abundance and distribution models produced by the Marine Life Data and Analysis Team (MDAT) represent a broader portion of a population often over a broader time period for a particular survey area (or set of survey areas). Users are urged to interpret data product outputs with these differences in mind.
In addition, the diving bird movement data products reflect a smaller sample size than the MDAT predictive distribution and abundance models for birds. This study sampled approximately 400 individuals largely captured on Mid-Atlantic wintering grounds over five years, while the MDAT models reflect thousands of observations over several decades.
MDAT bird models do not cover Long Island Sound, Delaware
Bay, Chesapeake Bay, and other nearshore or estuarine areas, which were found
to be heavily utilized by the three species in this study. In general, however,
there is agreement between the results of this tracking study and the MDAT
models in the distributions of all three species in winter.
More Info on Webinar
The Northeast Ocean Data Portal, in coordination with the US Fish and Wildlife Service, held an expert webinar about the maps on Jan. 10, 2020. You can view the video below.
Share this story