
The North Atlantic right whale models in the Portal’s Marine Life Library were recently featured in a new scientific paper in the journal Marine Ecology Progress Series. The publication documents the first-ever use of acoustic data to evaluate and confirm the model predictions, which are based on visual survey data and environmental parameters.
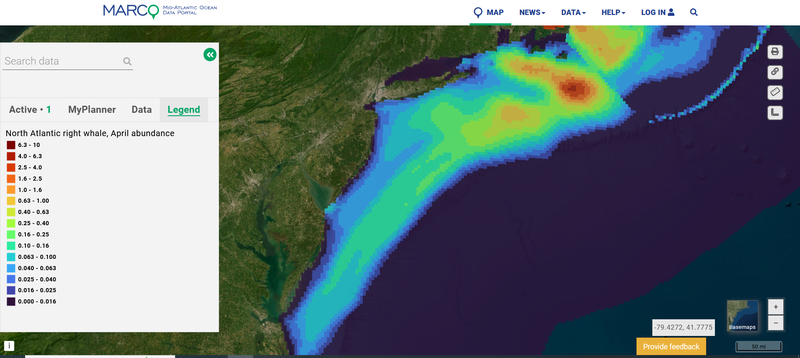
A map showing North Atlantic right whale April abundance.
The paper describes in detail the input datasets and methodology used to map right whale distributions and estimate the number of whales per square kilometer at different points in time.
The Duke Marine Geospatial Ecology Lab, which also leads the Marine life Data & Analysis Team (MDAT), collaborated with 11 institutions and pooled 17 years of visual survey data covering 9.7 million square kilometers to build the models. The visual data were coupled with auditory data from almost 500 hydrophone recorders in U.S. Atlantic waters that captured whales’ calls.
The work resulted in mean monthly density and uncertainty maps for the 2003-2009 and 2010-2020 eras, based on the significant changes in the species’ spatial distribution that began around 2010. The results quantify the striking distribution shifts and provide effort- and bias-corrected density surfaces to inform risk assessments, estimations of take, and marine spatial planning.
The maps representing monthly right whale densities from 2010-2020 can be viewed in the Marine Life Library (Species Specific) theme by clicking any of the five Marine Mammal dropdowns (Abundance, 5th Percentile, 95th Percentile, Coefficient of Variation, Standard Error). From there, users can type “North Atlantic right whale” into the search widget for a list of monthly maps to choose from. (Choices will appear after entering the first few letters.)
Additional Information
Press release from Duke University: Where Have All the Right Whales Gone?
Download the North Atlantic right whale models.
CITATION: “North Atlantic Right Whale Density Surface Model for the US Atlantic Evaluated With Passive Acoustic Monitoring,” Jason J. Roberts, Tina M. Yack, Ei Fujioka, Patrick N. Halpin, Mark F. Baumgartner, Oliver Boisseau, Samuel Chavez-Rosales, Timothy V. N. Cole, Mark P. Cotter, Genevieve E. Davis, Robert A. DiGiovanni Jr., Laura C. Ganley, Lance P. Garrison, Caroline P. Good, Timothy A. Gowan, Katharine A. Jackson, Robert D. Kenney, Christin B. Khan, Amy R. Knowlton, Scott D. Kraus, Gwen G. Lockhart, Kate S. Lomac-MacNair, Charles A. Mayo, Brigid E. McKenna, William A. McLellan, Douglas P. Nowacek, Orfhlaith O’Brien, D. Ann Pabst, Debra L. Palka, Eric M. Patterson, Daniel E. Pendleton, Ester Quintana-Rizzo, Nicholas R. Record, Jessica V. Redfern, Meghan E. Rickard, Melanie White, Amy D. Whitt, Ann M. Zoidis. Marine Ecology Progress Series, March 20, 2024. DOI: 10.3354/meps14547; online: https://doi.org/10.3354/meps14547
The Duke Marine Geospatial Ecology Laboratory leads an ongoing collaboration of federal, state, academic, and independent research organizations who pool scientific data and expertise to develop marine mammal species density models spanning the U.S. east coast and southeast Canada. The models estimate absolute density, rendered as maps of the number of individual animals per 100 km2, by statistically correlating sightings reported on shipboard and aerial surveys with oceanographic conditions. Since its initial publication in 2016, the project has expanded to utilize over 2.8 million linear kilometers of survey effort collected between 1992-2020, yielding density maps for over 30 species and multi-species guilds. All of these maps can be viewed in the Northeast Ocean Data Portal.
The Regional Wildlife Science Collaborative for Offshore Wind (RWSC), which is cohosted by NROC and MARCO, maintains a map of active passive acoustic monitoring sensors in U.S. Atlantic waters. Several of these sensors were used in the publication described above. Data from many of these sensors can be visualized over time in NOAA Fisheries’ Passive Acoustic Cetacean Map.