The many places and ways people interact with the Mid-Atlantic Ocean are summarized in 10 new easy to understand maps on the Portal.

The Human Use Data Synthesis (HUDS) project addressed a key limitation with online mapping applications – namely, that when multiple layers are turned on, the overlapping areas can appear murky and difficult to decipher. Now, over 60 map layers depicting the presence of human activities and infrastructure have been consolidated into 10 layers that cover broad themes such as fishing, security and energy.
The HUDS maps will make the Portal an easier and more efficient tool for informing ocean planning decisions, while also providing casual users with a snapshot of the places at sea where people are most active.
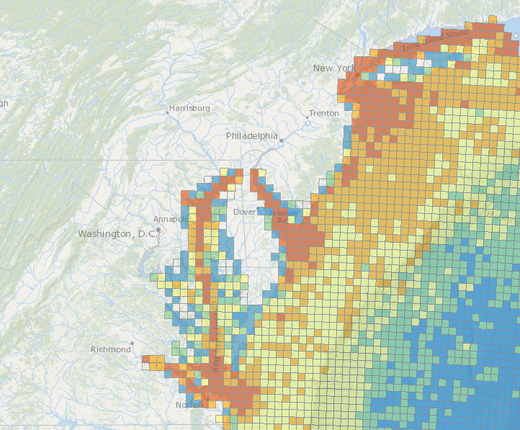
One of the challenges of the HUDS project was converting data that was originally represented by varying symbols, such as lines, dots and polygons, into maps that use a common design. The gridded HUDS maps are made up of squares that each represent 10 kilometer by 10 kilometer areas. Hotter colors such as reds and oranges show where many human uses are present while cooler colors such as blue or transparent squares denote fewer or no uses.
Users can click on any cell for a pop-up that provides specific information about the site. Although the colors and pop-up data can serve as indicators for the intensity of human activities in a given area, that is not always the case.
“You can have an area with several datasets showing up, but in truth, the [actual intensity of] activity can be quite low,” HUDS project lead Melanie Gearon Schroeder of the firm RPS ASA noted during a Jan. 29 presentation. “Or vice versa, you can have an area with one activity, which could be one type of fishing, but it can be the most heavily fished square in the Mid-Atlantic.”
To access the HUDS data, go to Marine Planner and click on the Human Use Data Synthesis link under the data tab. Information about the source data included in each of the HUDS themes can be found by clicking on the green “i” icon to the left of each layer name.
Click here to read the project final report.
HUDS "How Tuesday" Webinar
Join us May 3 at 1 p.m. for a “How Tuesday” webinar exploring the HUDS project. Guest host Melanie Schroeder Gearon will share additional insights on the HUDS and provides a guided tour of the new data on the Portal. For more information or to pre-register, email kvilacob@monmouth.edu.