A new map in the Portal’s Oceanography theme models typical wave heights, directions and intervals at sea and in major estuaries from Maine to Florida.
The Atlantic Wave Height and Climate map layer was developed by the Pacific Northwest National Laboratory, through the U.S. Department of Energy’s National Renewable Energy Laboratory, and published by MarineCadastre.gov. It is based on modeled high-resolution wave hindcasts from a 32-year period (1979 to 2010).
Hexagonal cells on the map are color-coded according to their average significant wave height, with blues representing low heights and reds representing high ones. Significant wave height (also commonly referred to as “seas”) is an average measurement of the largest 33 percent of waves and is used by researchers to filter out smaller waves and choppy conditions that are not as important for purposes such as marine operations, ocean planning or coastal resilience studies.
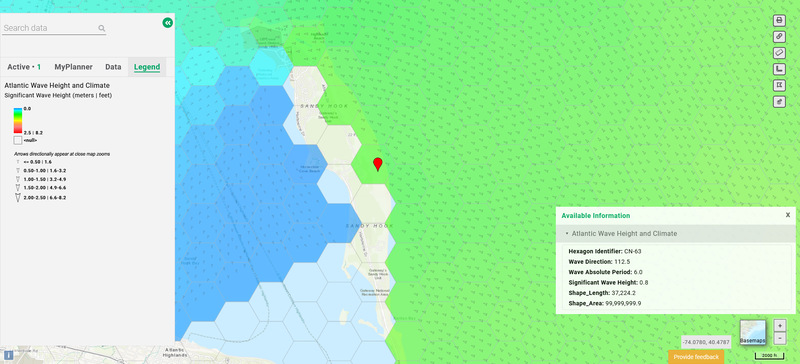
Wave heights and directions near Sandy Hook, New Jersey.
Users can click on any cell for a pop-up window containing the following statistical information:
- Significant Wave Height: Presented in meters.
- Wave Direction: Average directions presented in degrees, with a 0 indicating that waves typically flow from true north to south, a 180 indicating south to north, a 90 indicating west to east, and a 270 indicating east to west. Upon a close zoom, arrows will appear on the map to show the typical direction of waves. The arrows are sized in proportion to the cell’s significant wave height value, with larger arrows representing greater heights.
- Wave Absolute Period: The typical number of seconds between the peaks of waves passing through a given area.
The layer is one of a collection of maps designed under the direction of MarineCadastre.gov to support multiple ocean use activities such as project siting and ocean engineering. Others available focus on the West Coast and Hawaiian waters. For more information about the data, view this presentation by Jeremy Fontenault of RPS Group delivered at February’s Coastal GeoTools Conference.