(Updated 7/26/23)
In addition to the many updates reported in the News section, the following data additions and enhancements were recently made to the Portal.
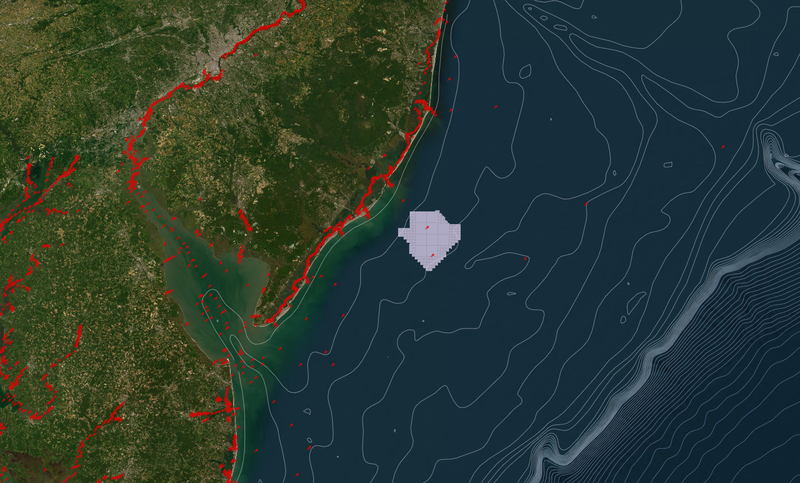
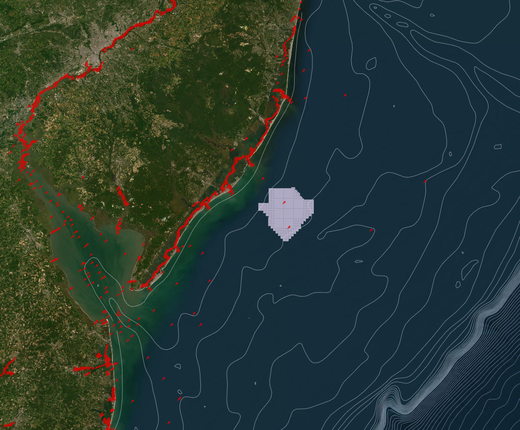
An overlay showing the Aids to Navigation, Atlantic Shores Offshore Wind Projects 1 and 2, and Bathymetric Contours map layers.
Kitty Hawk, Atlantic Shores, SouthCoast Wind, Beacon Wind: Individual project envelopes for the Avangrid Renewables LLC (aka Kitty Hawk North Wind), Atlantic Shores Offshore Wind Projects I and II, SouthCoast Wind Energy (formerly Mayflower Wind Energy), and Beacon Wind LLC areas have been added to the Renewable Energy Theme’s “Projects Under Review” collection. The areas are located off the coasts of North Carolina, New Jersey and Massachusetts, respectively. (The areas can also be viewed along with others throughout the U.S. in the BOEM Active Renewable Energy Lease Areas layer.)
South Fork, Ocean Wind I, Vineyard Wind Projects: Individual project envelopes and proposed infrastructure (turbines, substations, interarray cables and export cables) locations for the South Fork Wind Farm off Long Island, Ocean Wind I project off New Jersey, and Vineyard Wind 1 project off Massachusetts have been added to the Renewable Energy theme’s “Permitted Projects” collection.
Coastal Wetlands: The Portal’s former Estuarine Wetlands layer has been replaced by this U.S. Fish and Wildlife Service data, available in the Habitat theme. The map shows the extent, approximate location and type of estuarine and marine wetland habitats in coastal areas from Virginia to Maine.
Aids to Navigation: The Portal’s Aids to Navigation (ATON) map layer has been replaced with a new version provided by MarineCadastre.gov containing the latest locations of buoys, lights, signals, and other infrastructure intended to guide mariners and warn of dangers/obstructions. Users can click any point for a popup containing details on the ATON. (Users may need to zoom in to view the points.)
Bathymetric Contours: Based on multibeam sonar data, this layer shows lines that represent the progression of depths along the seafloor within the U.S. exclusive economic zone. Contour lines are presented at intervals of every 10 meters for depths from 0-100 meters; 25 meters for depths from 101-500 meters; and 100 meters for depths beyond 501 meters. Click on any line for a popup containing its depth. The layer, provided by MarineCadastre.gov, can be found by clicking the “Bathymetry” dropdown in the Seafloor Habitat theme.
Questions or comments? Contact us at portal@midatlanticocean.org.