View the places at sea, in coastal waterways and estuaries where the waters are being monitored for signs of increasing acidity with a collection of maps in Marine Planner.
The Portal’s acidification-related maps can be found by clicking on the “Acidification Monitoring Locations” dropdown in the Water Quality theme. Earlier versions of these maps have been expanded to include information for nearly 20,000 additional sites where sampling is currently being or has been conducted in the Mid-Atlantic. Taken together, the maps are serving as a valuable tool for the Mid-Atlantic Coastal Acidification Network (MACAN) in its work to develop a robust network that monitors for changes to the region’s water chemistry.
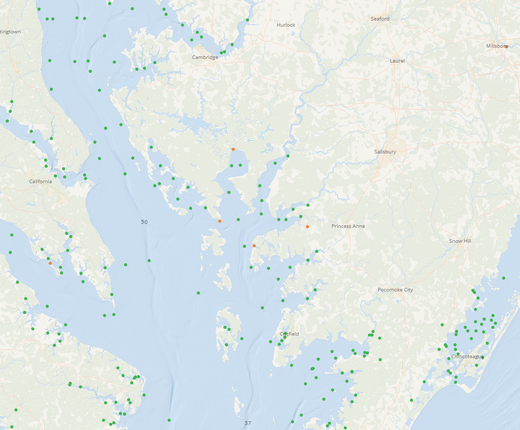
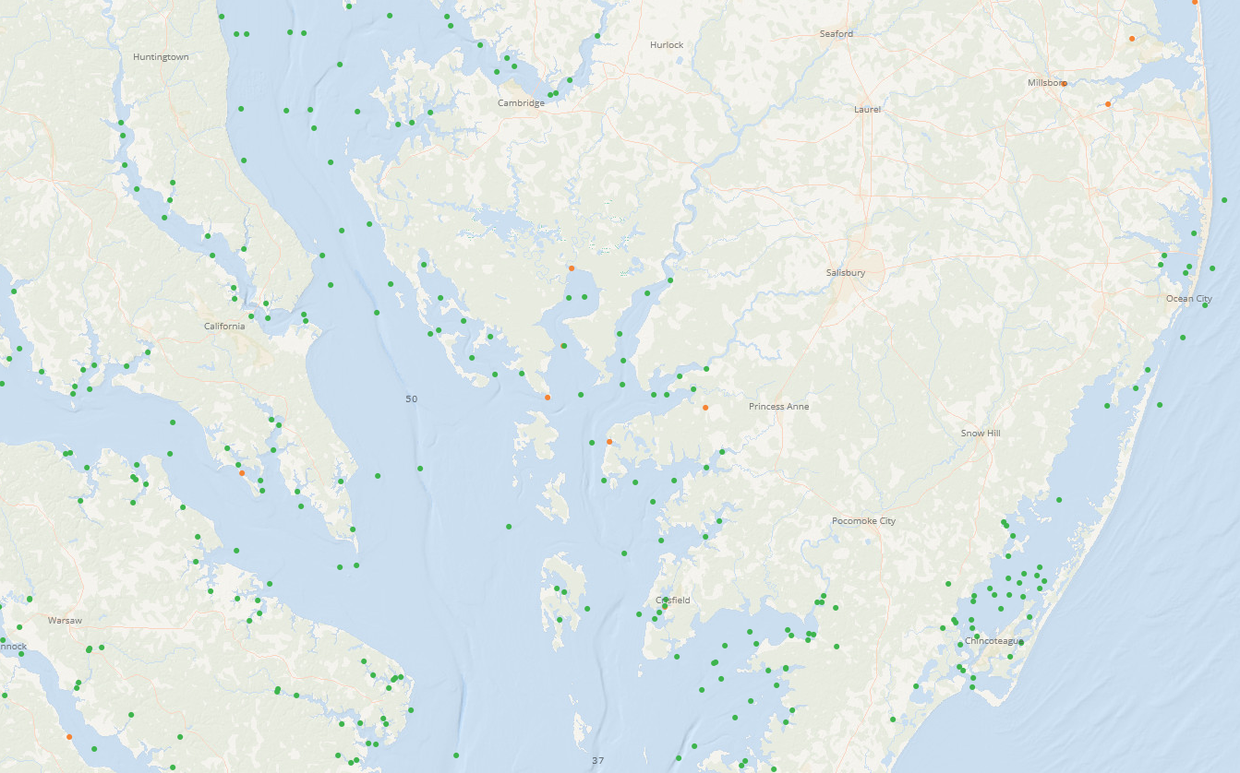
The Portal’s All Acidification Monitoring Sites map (shown above) breaks the sampling locations into eight data collection types: sites where samples were drawn with a bottle and measured with a CTD (conductivity, temperature and depth) meter; sites that are being continuously monitored (often a fixed station with technology measuring water at a regular interval); sites where both continuous and discrete monitoring (regular field sampling conducted by individuals) is taking place; sites where one-time samples were taken during cruises; sites where both cruises are underway and discrete sampling is taking place; sites where a cruise is underway; sites where discrete monitoring is taking place; and sites where readings were taken by a glider.
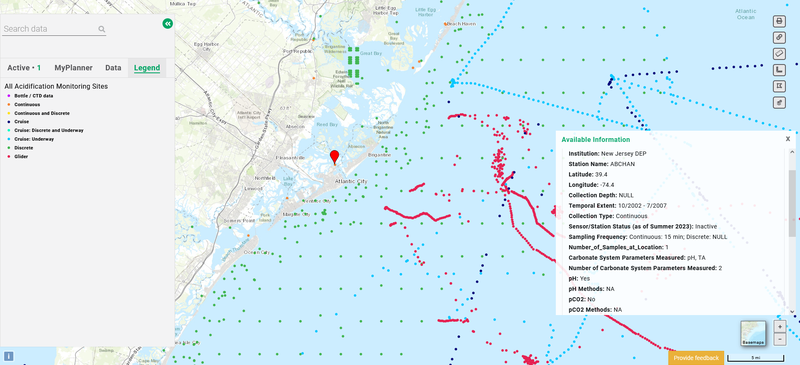
Users can click on any of the individual points for a pop-up with information about the location, the organizations collecting data and the types of information gathered. The maps do not present the monitoring data itself, but do link to the data where possible.
The acidification monitoring sites are also broken down into six additional maps that were identified by scientists and other MACAN stakeholders as useful for developing the monitoring network. They are:
- Active Sites as of Summer 2023: Shows only continuous monitoring sites and ongoing fixed stations. Cruise sample locations and former fixed stations are not shown.
- pH Sites: Shows sites where pH is/was measured.
- pCO2 Sites: Shows sites where partial carbon dioxide is/was measured.
- TA Sites: Shows sites where total alkalinity is/was measured.
- DIC Sites: Shows sites where dissolved inorganic carbon (DIC) is/was measured.
- Sites by Number of Parameters: Shows how many of the four parameters above are/were measured at each monitoring site.
Acidification in the Mid-Atlantic
Ocean acidification is being driven by increased levels of carbon dioxide dissolving into seawater, increasing its acidity and lowering its pH. Scientists believe the Mid-Atlantic region may be especially vulnerable to acidification in its coastal waters, where high nutrient levels and rapid growth of plankton further reduce pH. OA causes organisms to expend more energy to regulate their body chemistry and reduces the availability of calcium carbonate, which corals, clams, oysters, lobsters, and other species require to build and maintain shells and skeletons.
MACAN was formed in 2016 to examine and gather information about acidification in the five-state Mid-Atlantic region spanning from Long Island through Virginia. It is coordinated by the Mid-Atlantic Regional Association Coastal Ocean Observing System (MARACOOS) and the Mid-Atlantic Regional Council on the Ocean (MARCO). Visit midacan.org for more information.
The maps will continue to be updated as additional information about monitoring sites emerges. If you have information that you believe should be included in these maps, please contact info@MidACAN.org.