What areas of the Mid-Atlantic see the most intense shipping traffic each year? How much does overall vessel traffic change from its peak summer months to the winter? Where do vessel activities show strong connections with other features such as artificial reef locations and ports?
Portal users can study 2018 and 2019 traffic patterns for several types of vessels with a series of new maps based on Automatic Identification System (AIS) data. With the latest additions, the Portal now houses a total of 540 AIS maps showing vessel activity for years and months dating back to 2011.
The new vessel traffic datasets and interactive maps were developed in collaboration with our partners from the Marine Cadastre, which obtained the data from the U.S. Coast Guard and processed it for regional and other partners to use. The data were then used by Northeast Ocean Data Portal to develop regional maps by vessel type and shared with the Mid-Atlantic Ocean Data Portal. Partners from the U.S. Coast Guard and the maritime industry have also contributed valuable input at numerous presentations and briefings, helping to guide how the data should be processed and presented to maximize their accuracy and usefulness. Additional presentations to the maritime community over the next year will help us to better understand the activity these maps depict and how the information could be used.
Since 2002, large vessels operating in U.S. waters have been required to carry AIS transponders, which send automated signals to nearby ships, onshore infrastructure and satellites indicating their identity, purpose, course and speed. Originally envisioned as a post-9/11 security measure, AIS data is now used by the public and private sectors for a far wider range of uses, including maritime safety, ocean planning and environmental protection.
The latest data includes maps depicting traffic for all vessels carrying AIS technology in 2018 and 2019; and maps that break out only cargo, fishing, tug/tow and passenger vessels; pleasure craft/sailboats; tankers; or “Other” vessels that don’t fit in these classifications.
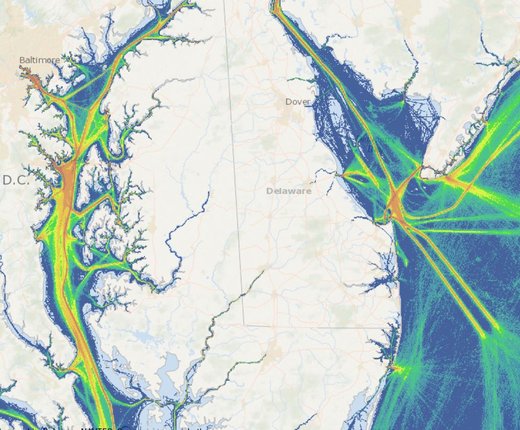
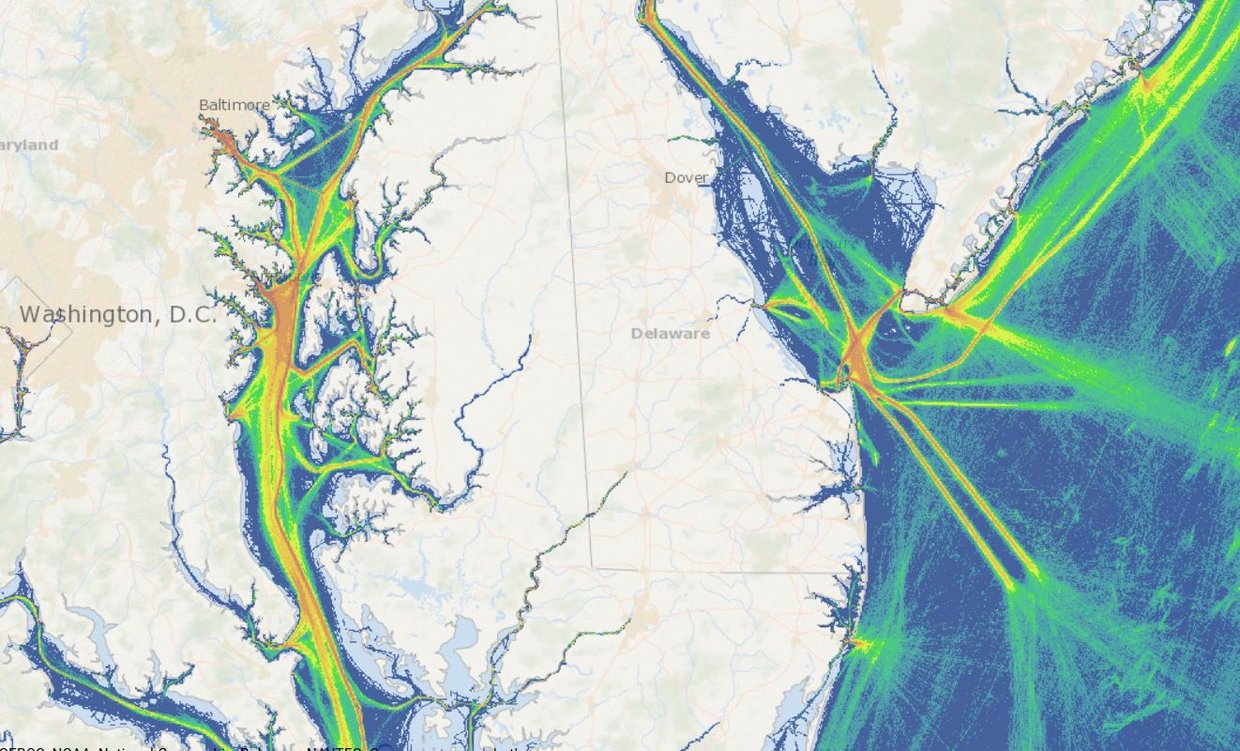
Reds, oranges and yellows in the maps indicate where vessel concentrations were highest, while cooler colors note where traffic was less intense. Specifically, the reds represent 100 meter grid cells where there were more than 500 transit counts while the darkest blues show areas with 10 or less. (The Portal’s 2011, 2012 and 2013 maps display relative density rather than actual vessel transit counts.) See the Maritime section of the Portal’s Data Catalog for more information about the AIS data and download options.
Viewing AIS Monthly Sliders
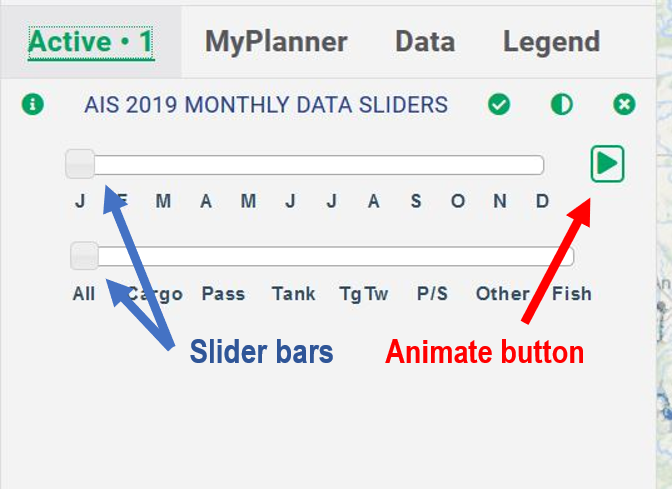
Users can view annual maps by clicking on AIS Vessel Transit Counts (by desired year) for a dropdown menu of vessel types, or choose the AIS Monthly Data Sliders option to toggle through or animate monthly maps. Using the Slider and Animation Tool is easy. The following is a quick start guide, using the AIS 2019 Monthly Data Sliders as an example.
- Click to activate the AIS 2019 Monthly Data Sliders layer, found within the Maritime theme. (Load times may take several seconds, depending on technology and connection speeds.)
- Click on the "View Slider" button or switch from the Data tab to the Active tab to access the tool controls. Two slider bars will be available – a top bar to control the time interval (month) and a bottom one to select the vessel type.
- To automatically cycle through the monthly maps as an animation, click the play button icon to the right of the top slider bar. Users can also manually advance the toggle with a mouse to view a specific month.
- To change the data type (e.g. Cargo Vessel, Passenger Vessel), simply use the toggle to select from the available options.
Questions?
Questions or comments on these maps? We’d like to hear from
you. E-mail portal@midatlanticocean.org
or fill out the “Provide Feedback” button at the bottom of this page.