
Over two dozen maps now available on the Portal present a more detailed picture than ever before of the extent and locations of commercial fishing activities throughout the upper East Coast.

With the new “Communities at Sea” and Federal Vessel Monitoring System (VMS) map collections, Portal users can identify the ocean places upon which the Mid-Atlantic’s commercial fishing communities most depend. Specifically, these interactive maps enable users to better understand places that are most important for particular ports, specific fisheries, and gear types.
The public release of these datasets is an important step forward for ocean planning and education in the Mid-Atlantic. The maps can help focus and guide essential engagement and consultation with specific fishing communities for a range of ocean planning, permitting and management decision-making processes.
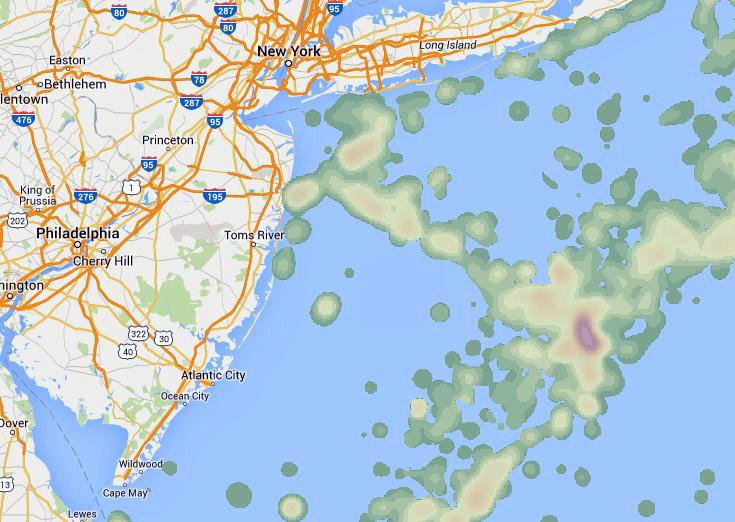
Over two years in the making, the Portal’s Communities at Sea maps (labeled in the Marine Planner mapping application as “Commercial Fishing – VTR”) were created using methodology developed by Dr. Kevin St. Martin at Rutgers University. Vessel Trip Report (VTR) and permit information were integrated to create a new database that links fishing port communities to the places at sea where they spend the most time. Produced at much higher resolution than previous VTR maps, warm and cool colors are used to represent higher and lower number of days spent fishing. Portal users can click on any point on the map to activate a pop-up window that indicates which specific communities use the area. For example, clicking on an area off the New Jersey Shore may reveal that that gillnetters from Barnegat Bay or trawlers from Ocean City fish in the selected waters.
The maps were reviewed, discussed and improved though
meetings with commercial fishermen throughout the Mid-Atlantic. The Communities
at Sea collection currently includes eight maps based on 2011-13 data and will
be expanded this summer via a new user interface for querying and selecting
from the full library of over 100 maps.

“We really appreciate the critique and advice we got from fishermen from Montauk to Virginia Beach during our map review sessions,” said Jay Odell, Technical Lead for the Portal and Director of the Mid-Atlantic Marine Program at The Nature Conservancy. “They noted some important strengths and limitations of the data and what we learned is helping to drive the development of an expanded map library that we hope to have ready for the Portal this summer.”
The Portal’s Data Catalog section summarizes some of the caveats
raised by commercial fishermen. For example, the maps are based on information
from recent years and may not represent fishing areas that were historically
important and could be again. Also, fishing patterns are driven by complex
ecological, regulatory and economic factors that can change from year to year.

The Portal’s 19 new Vessel Monitoring System (VMS) maps show areas where commercial fishing activities take place, grouped by specific regulated fishery categories (for example, scallops, herring or monkfish). These maps (labeled “Commercial Fishing – VMS”) were created by our ocean planning partners in the Northeast region using VMS data from 2006-2014. VMS data are produced by satellite technology that tracks the movements of vessels participating in several federally managed fisheries. This data is also presented in a heat map format, with cooler colors representing low activity and dark reds showing high activity.
The Communities at Sea and VMS maps can be layered together on the Portal in complementary ways to provide rich detail about the region’s fishing communities and the ocean places they depend on. Both datasets were carefully screened and aggregated by NOAA before maps were made so that the fishing activity of individual fishermen or vessels would not be revealed.

Finally, additional maps were added at the request of commercial fishing advisors to show the boundaries of some of the region’s important fishery management zones, including ocean quahogs, surf clams and scallops. Additional regulatory boundaries may be added in the future based on specific interests and requests.
To access and explore the new maps, please visit the Marine Planner page and click on the Fishing link for a dropdown menu of map layer options. Additional map options currently available in the Fishing theme include party and charter boat fishing activity, artificial reef locations and fathom lines.
Users can register for a free Portal account to start and join online map groups, draw and share their own map shapes, create and save map bookmarks and more. Please use the Portal’s feedback tab to share any comments, concerns or questions!