In collaboration with the University of Massachusetts School of Marine Science and Technology (SMAST) and Northeast Ocean Data Portal, a new map has been published on the Mid-Atlantic Ocean Data Portal that shows the results of a multi-year survey to characterize Atlantic sea scallop (Placopecten magellanicus) distribution. The Sea Scallops 2016-2018 Potential Reproductive Output map can be found by clicking on the Sea Scallops dropdown in the Portal's Marine Life theme.
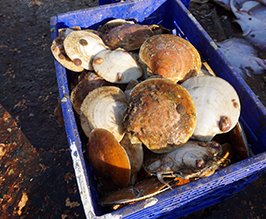
The survey, conducted by SMAST and published by Kevin Stokesbury and David Bethoney in Frontiers in Ecology and the Environment, measured scallop abundance and distribution from the scale of centimeters to thousands of kilometers over the species’ entire range. In 2017, the continental shelf was surveyed using a drop camera system (composed of a digital still camera and lights on a metal frame) measuring the number of scallops, their size, and their distribution, supplemented by surveys of other areas conducted in 2016 and 2018.
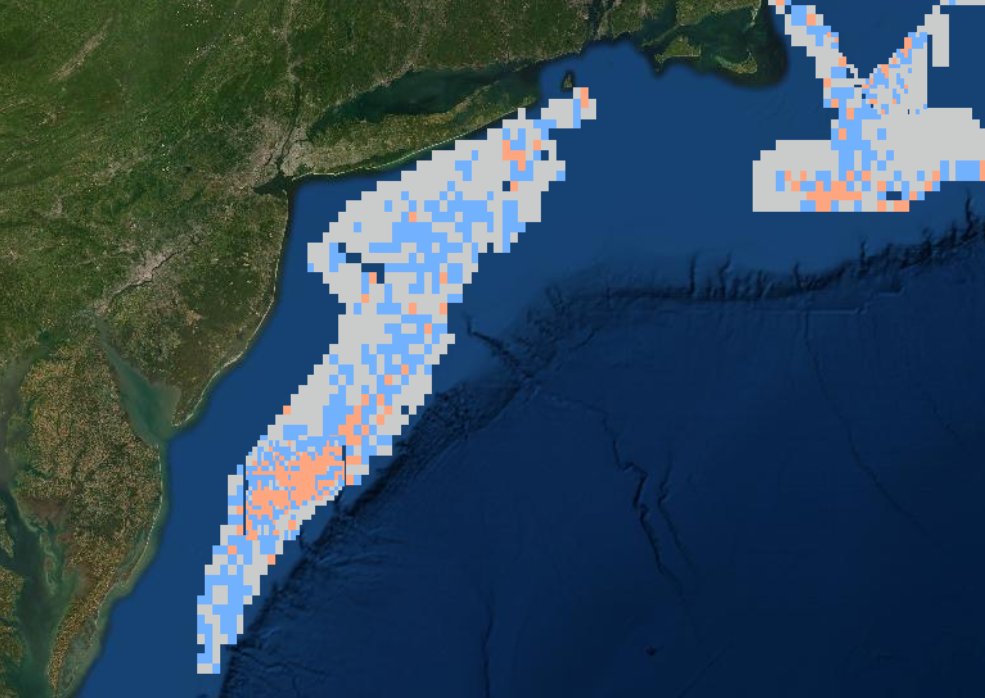
The resulting map shows estimates of the number of Atlantic sea scallops over 70,000 square kilometers of the continental shelf, an area that nearly covers the entire range of this species. In total, 22,592 quadrat samples were collected at 5,648 stations. The productivity of sampled areas was ranked by the presence or absence of scallops observed in each quadrat image: 0 scallops for low productivity, 1–2 scallops for medium productivity, and >2 or more scallops for high productivity. This sampling represents a snapshot in time; over the 20-year time-series of the U.S. resource, areas that at one time did not have scallops could potentially support high densities at a later date if a recruitment event were to occur. From these surveys, researchers estimated that there were 34 billion individual scallops (95% confidence limits: 22–46 billion) within the species’ range.
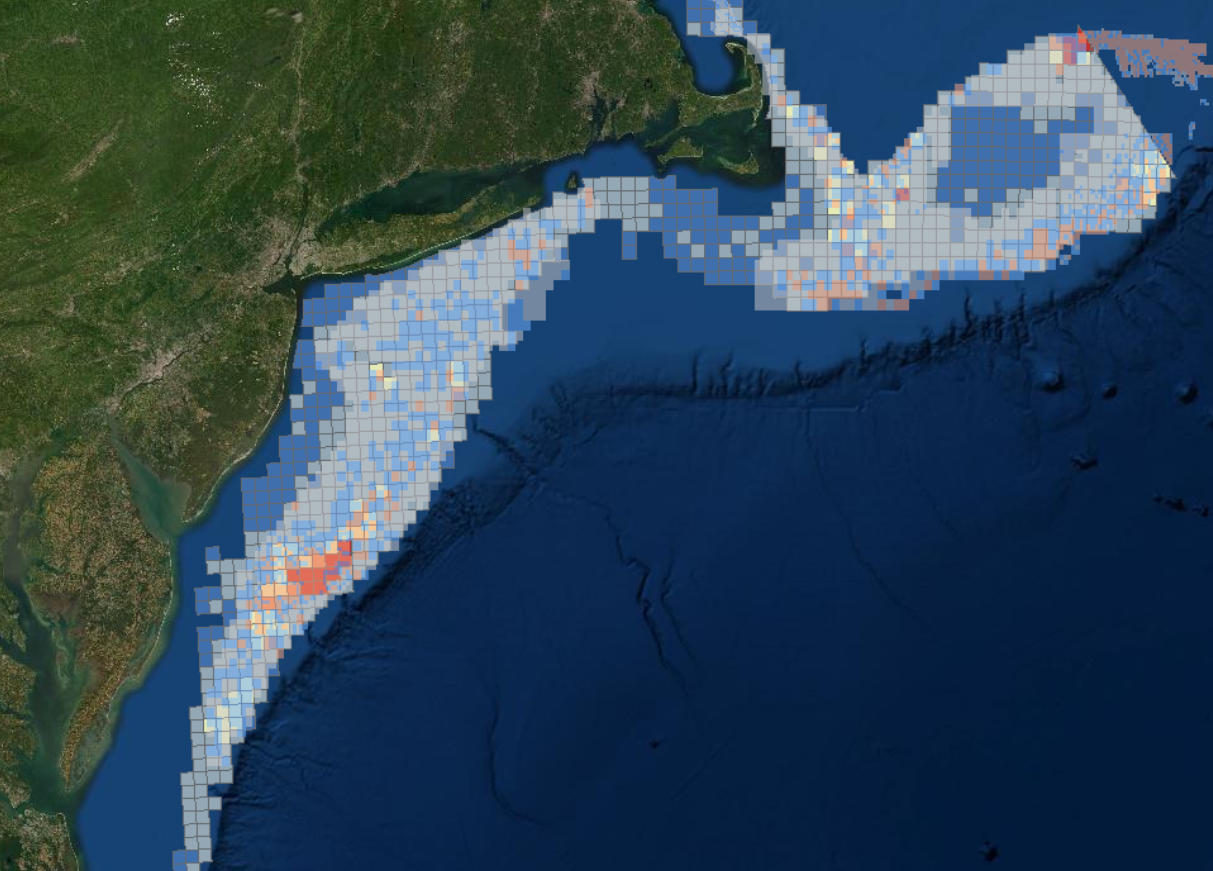
Portal users can overlay these new data with a longer-term Sea Scallop Average Abundance (SMAST) layer (from 2003-12) already accessible in the same Sea Scallops dropdown. Comparing the two layers (as seen to the right) confirms that the new data represent a snapshot in time, and that some Atlantic sea scallop “hot spots” were persistent over this time (e.g., Mid-Atlantic) whereas others may be more ephemeral (northern edge of Georges Bank).
The Sea Scallops dropdown also contains a third layer, Sea Scallops Biomass, Meat Weight in KG (NEFSC), which summarizes National Oceanic and Atmospheric Administration Northeast Fisheries Science Center dredge surveys from 1966 to 2014.