
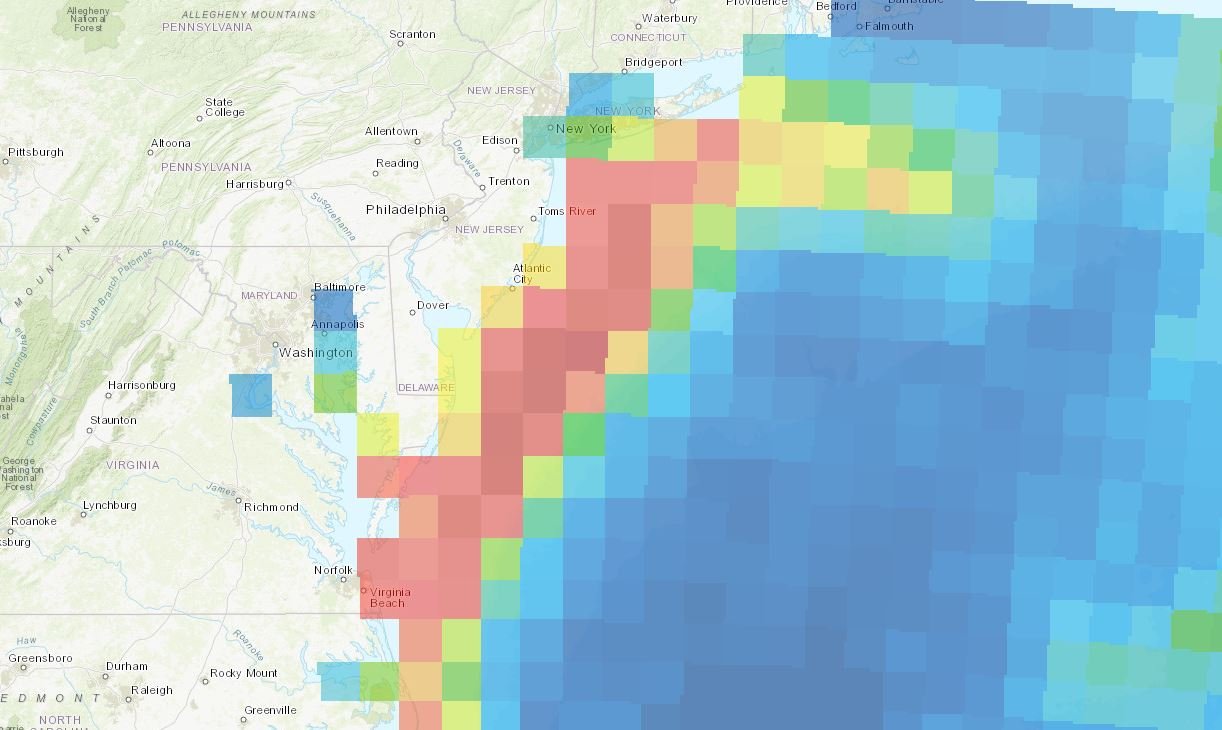
In partnership with the NOAA Northeast Fisheries Science Center (NEFSC) and the Northeast Ocean Data Portal, the Mid-Atlantic Ocean Data Portal has added 12 new map layers showing the monthly densities of tagged loggerhead sea turtles throughout southern New England and the Mid-Atlantic Bight.
The maps can be accessed by clicking on the Tagged Loggerhead Sea Turtle Density Monthly Slider layer, found in the Portal’s Marine Life theme. Users can then click “View Slider” to toggle through the maps manually or animate them automatically.
The new map layers represent data from 271 satellite tags deployed on large juvenile and adult loggerheads in the northwest Atlantic by six tagging programs between 2004 and 2016. A scientific paper describes the methods used to analyze the data and develop monthly data products that correspond to the spatial grid used by the inter-agency Atlantic Marine Assessment Program for Protected Species (AMAPPS). The high-density areas shown on these maps are based on over 10 years of satellite-tagging data and represent the relative distribution of tagged loggerheads that may be expected on average in a given month. For more detailed information about the study, read the paper by Megan Winton and coauthors in Marine Ecology Progress Series.