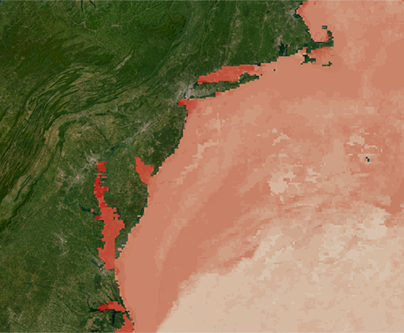
Seventeen new map layers showing seasonal averages for net primary productivity (NPP) from Newfoundland, Canada, to northern Florida have been added to Marine Planner. With the latest additions, the Portal’s collection of NPP map layers now covers every season from the winter of 2010 through the spring of 2022.
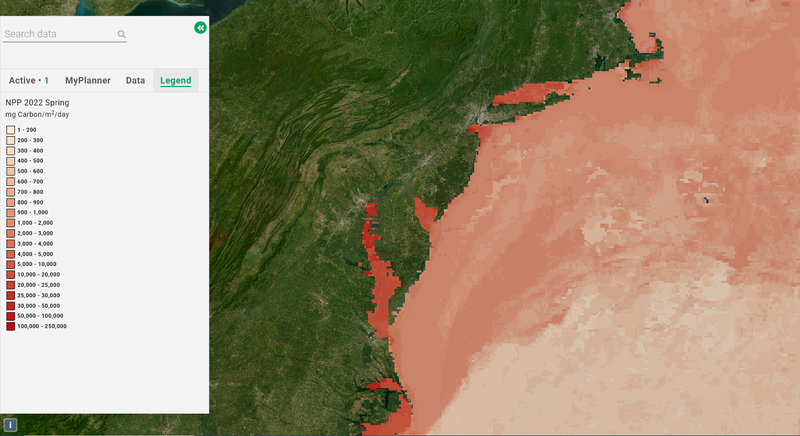
All of the maps can be found by clicking on the “Net Primary Productivity” dropdown in the Portal’s Oceanography theme. (Click here to view an interactive version of the NPP Spring 2022 map shown above.)
The NPP maps provide an indication of photosynthetic activity and how it changes by season at sea and in major estuaries such as the Chesapeake Bay, Delaware Bay and Long Island Sound. Specifically, net primary productivity measures how much more carbon dioxide aquatic plants digest than they release into the water and atmosphere. These primary producers form the base of the food chain and generate the biomass that sustains all life in the ocean.
The maps were generated by Rutgers University’s Grant F. Walton Center for Remote Sensing and Spatial Analysis for the Portal using data gathered by satellite observations and made available from NOAA CoastWatch. They provide a snapshot of season-wide trends based on real-time observational data.
The Oceanography theme offers eight categories of data that include map layers depicting average monthly sea bottom temperatures, seasonal ocean fronts, typical currents by season, wind speeds at sea and historic coastal storm tracks.