How valuable is the ocean to your local economy? Find out with a new collection of economic data viewable in Marine Planner.
The Portal recently debuted its first map product showing economic information, which can be accessed by clicking the Socioeconomic theme under the Data tab in Marine Planner. The Socioeconomic theme currently contains one map layer – Ocean Economics GDP – with more to be added in the future.
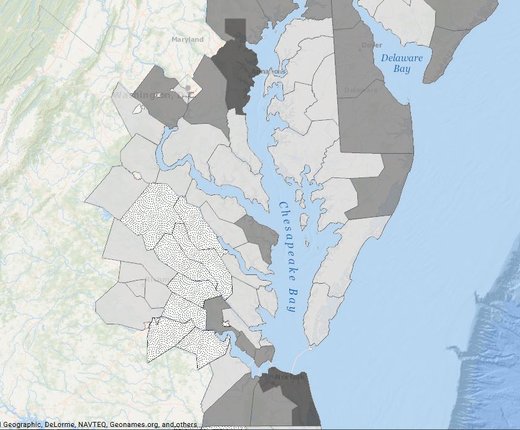
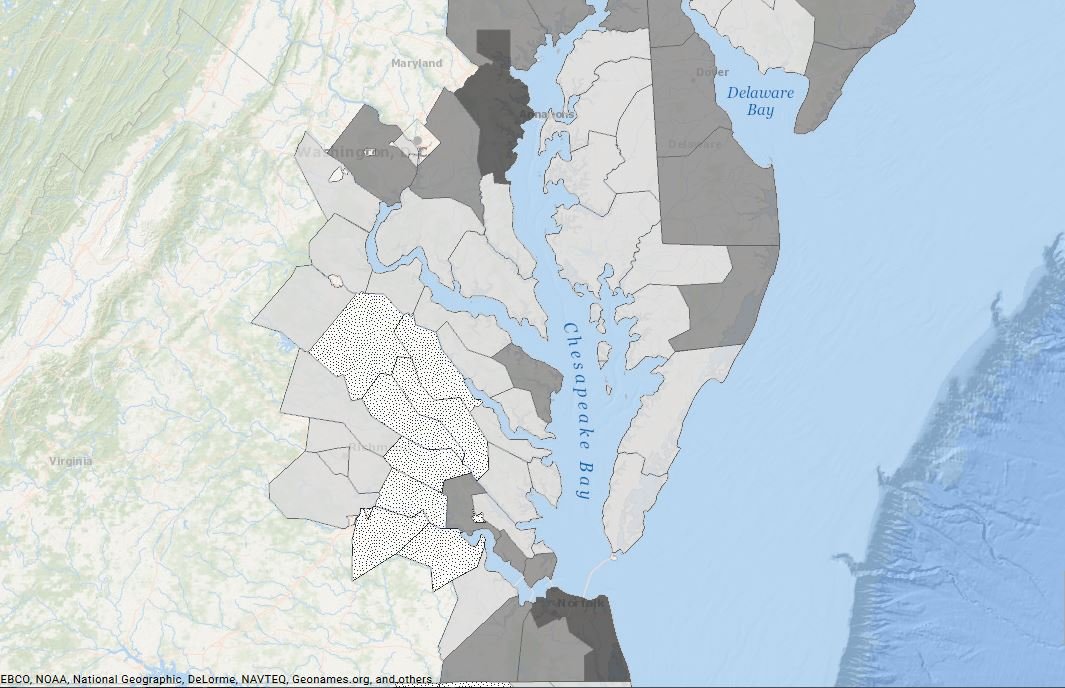
Ocean Economics GDP is an interactive map that illustrates the revenues generated by ocean-dependent businesses, such as tourism, recreation, ship-building and marine transportation. Counties are shaded from lightest (lower GDP) to darkest (higher GDP) to indicate the level of economic activity taking place in each area.
Users can click on individual counties for a pop-up window that displays figures for employment, wages, GDP and the total number of ocean-dependent businesses in those areas. At the bottom of the list is a "ToolLink" URL that users can visit for additional facts and figures, including federal employment data from previous years.
The economic data are derived from the Economics: National Ocean Watch (ENOW) Explorer database, available through the National Oceanic and Atmospheric Administration’s Office for Coastal Management Digital Coast Partnership. Statistics are based on data collected in 2013.