
View the most popular areas for whale and dolphin watch tourism off the Mid-Atlantic coast with a new map in the Portal’s Recreation theme.
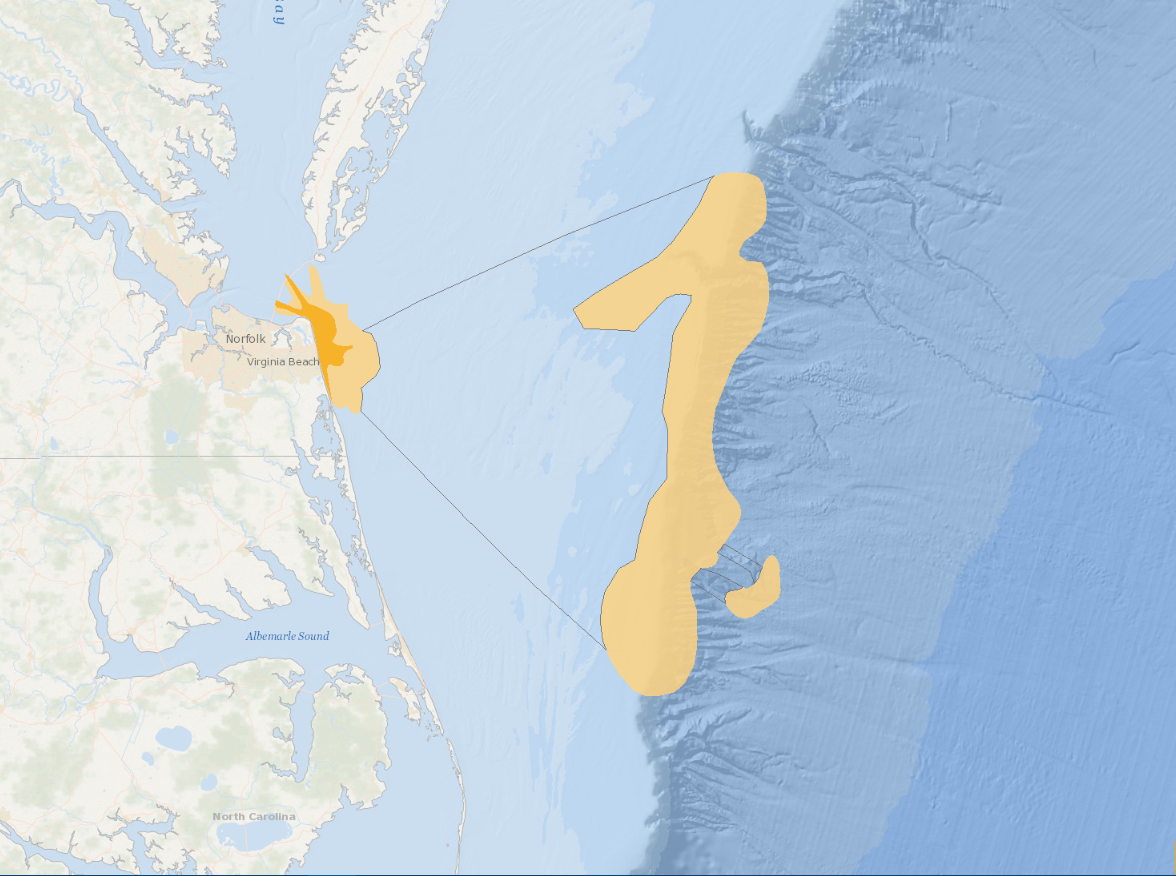
The whale watch industry has seen significant growth in the Mid-Atlantic over the last decade, spurred by a resurgence of humpback whale sightings off the coasts of the New York City area and northern New Jersey (as chronicled in this Ocean Stories profile of Gotham Whale). The Portal map shows the areas that are frequently toured by both newer vessels and longstanding operations based in ports such as Cape May, New Jersey, and Virginia Beach, Virginia.
The Commercial Whale and Dolphin Watch Areas layer was created through input provided by tour operators (including owners, captains and naturalists) and marine mammal experts as well as an analysis of Automatic Identification System (AIS) tracks for tour vessels operating in the region from 2015-20. Using AIS data, MARCO created an initial map to simulate “Dominant” (most frequently toured) areas and “General” areas for whale and dolphin watch tours from the New York Harbor vicinity to the Virginia coast.
The map was refined following a series of meetings in 2021 and 2022 with the tour operators and experts, who provided information including important areas for vessels that don’t carry AIS transponders, and therefore weren’t represented by the initial data; and areas where the AIS data was showing non-tour trips (such as fishing charters) and should be eliminated. MARCO thanks the many whale watch representatives and experts who participated in the process for their valuable contributions to the map.

Once complete, the Mid-Atlantic data was combined with an existing map layer on the Northeast Ocean Data Portal to create a consolidated map showing watch areas from Maine through Virginia. The Northeast Portal’s whale watch data, which covered areas from the Maine to New York, depicted activity areas mapped by whale watch industry experts in 2020, using the Northeast Coastal and Marine Recreational Use Characterization Study (conducted in 2015 by SeaPlan, the Surfrider Foundation, and Point 97 under the direction of the Northeast Regional Planning Body) as a starting point. In additional to Dominant and General tour areas, the Northeast data included the following categories, which can be seen in the new layer:
- Transit routes used for transit to and from General or Dominant use areas.
- Supplemental areas used for closely-related activities and infrequent specialty trips.
- RI Ocean Special Area Management Plan areas were mapped as part of the Rhode Island Ocean Special Area Management plan and are symbolized separately to reflect different data collection methodologies.
The map is chiefly focused on operators whose primary activity entails regularly scheduled trips dedicated to finding and observing whales and dolphins in their natural habitat. There are many additional vessels in the region that offer whale and dolphin watches as a smaller portion of their operations. Users are encouraged to consult the metadata for additional details on the map.
More Marine Mammal Data on the Portal

Users can explore hundreds of additional maps on the Portal for information about marine mammal distributions and habitats in the region. The Marine Life theme contains a “Marine Mammals” dropdown with maps that model the total abundance, core abundance areas, and species richness for eight groups of cetaceans that belong to common biological groups or address key management needs (e.g. All Cetaceans, Baleen Whales, Sound Sensitivity Low Frequency). Users can also view maps of monthly and annual distributions for 30 species of marine mammals in the Marine Life Library (Species Specific) theme. Many of these products were updated in the spring.
In collaboration with the National Oceanic and Atmospheric Administration (NOAA) Marine Mammal Health and Stranding Response Program and members of the U.S. National Marine Mammal Stranding Network, the Portal recently published a series of maps showing marine mammal strandings by species/group, season and county. The maps are based on 20 years of data and show reported stranding locations from Maine to Virginia.
The Maritime theme contains a North Atlantic Right Whale Seasonal Management Areas layer showing zones where speed limits are enforced for large vessels at certain times of year to reduce the likelihood of deaths and serious injuries to these endangered whales that result from collisions with ships. The data is provided by the NOAA Fisheries Greater Atlantic Region Fisheries Office.
Questions or comments? Email portal@midatlanticocean.org.