
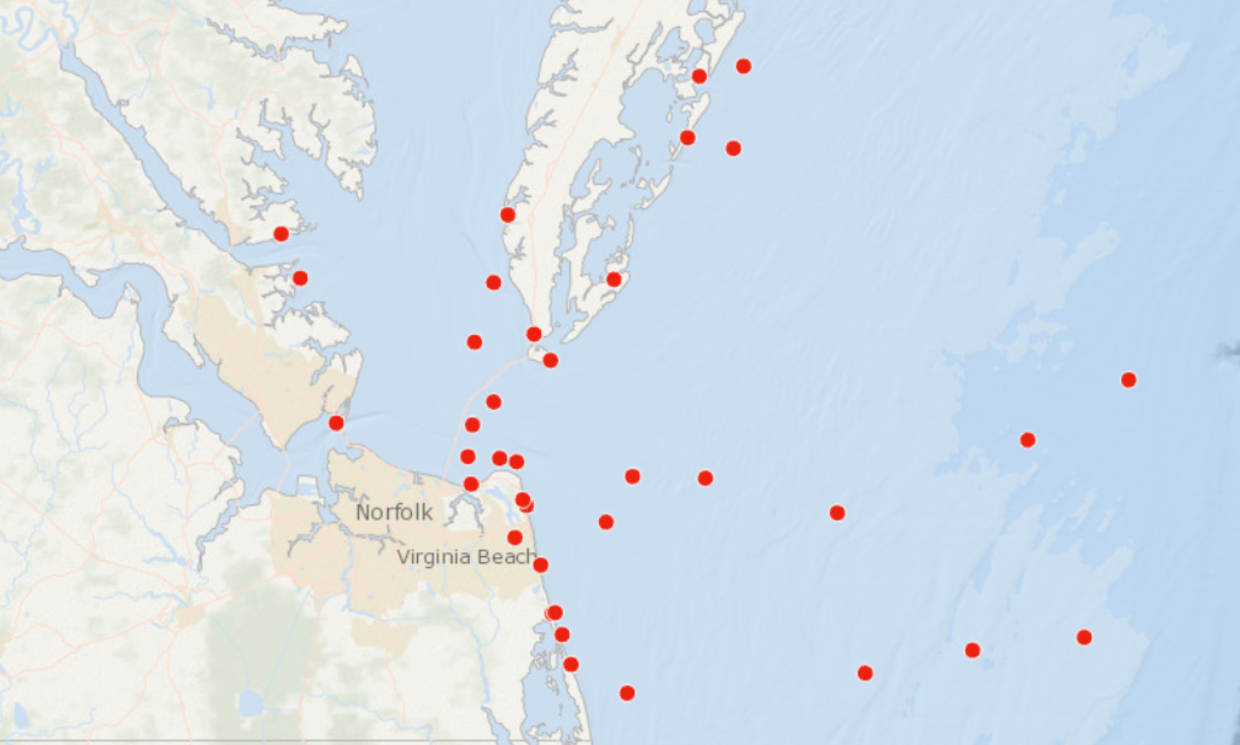
A series of new maps on the Portal show the sites of thousands of sea turtle strandings reported from 2000 through 2020 from Maine to Virginia. The maps were created from data maintained and provided by the National Oceanic and Atmospheric Administration (NOAA) Sea Turtle Stranding and Salvage Network (STSSN).

The STSSN is a cooperative effort comprised of federal, state, and permitted private partners that respond to live and dead stranded turtles, collect scientific data, transport sick and injured turtles to rehabilitation facilities, and help educate the public about sea turtle conservation. The STSSN works to inform causes of morbidity and mortality in sea turtles by responding to and documenting sea turtles in a manner sufficient to inform conservation management and recovery.
NOAA Fisheries maintains a database containing the species, date of initial observation, location of stranding, condition at initial observation, sex, age class, condition and other data fields for all strandings. MARCO used portions of this data to develop the following 12 maps on the Portal.
Sea Turtle Strandings: County Summaries: Provides the number of overall stranding events reported by county. Circle icons floating over each county are sized commensurate with the number of strandings.
Sea Turtle Strandings: By Season: Where stranding events for all sea turtle types were reported in the winter, spring, summer, and fall.
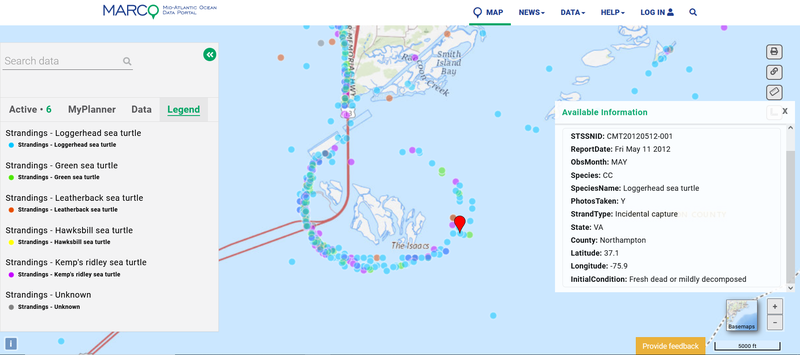
Sea Turtle Strandings: By Species: Where strandings were reported for loggerhead, green, leatherback, hawksbill, Kemp’s ridley, or unknown sea turtles.
Sea Turtle Strandings: By Type: Where strandings were reported by three common types:
- Cold stunning: Cold-stunned sea turtles are those suffering the ill effects of prolonged exposure to temperatures below 50°F (10°C).
- Incidental capture: When a sea turtle is caught incidental to (i.e., not the purpose of) an activity such as fishing (recreational or commercial), dredging activities, relocation trawling, non-sea turtle research activities, or power plant operations. (Note: Whether an incidental capture is documented through the STSSN may be optional depending upon the circumstances and may vary by state. Incidental captures recorded by NOAA Fisheries observer programs are not reflected in this data unless the network was involved [for example, to assist with disentanglement, necropsy, or rehab for a living sea turtle].)
- Traditional stranding: When a dead, sick, or injured sea turtle is found washed ashore, floating, or underwater, and when it is not an incidental capture or a cold-stunning. Traditional strandings do not involve healthy, uninjured sea turtles.
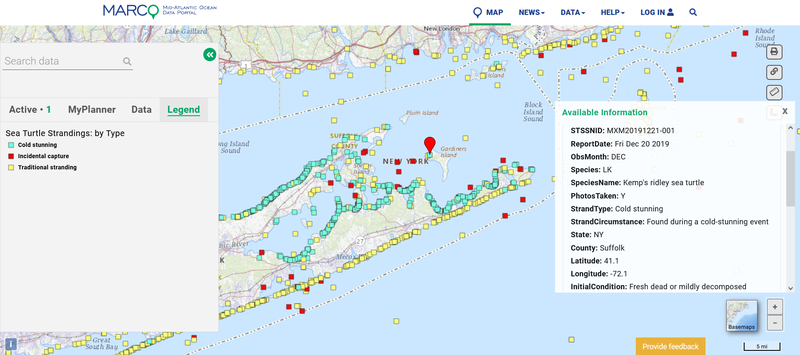
Above: A map showing sea turtle strandings by type.
When displaying any of the species, seasonal or stranding type map layers, Portal users can click on any point for a pop-up containing information collected by responders, such as the animal’s observed condition, the incident date and report number. Further information on particular stranding events may be obtained by contacting the stranding network organization that responded. Read the metadata for additional explanations of terminology and caveats associated with the data.
More Sea Turtle Data on the Portal
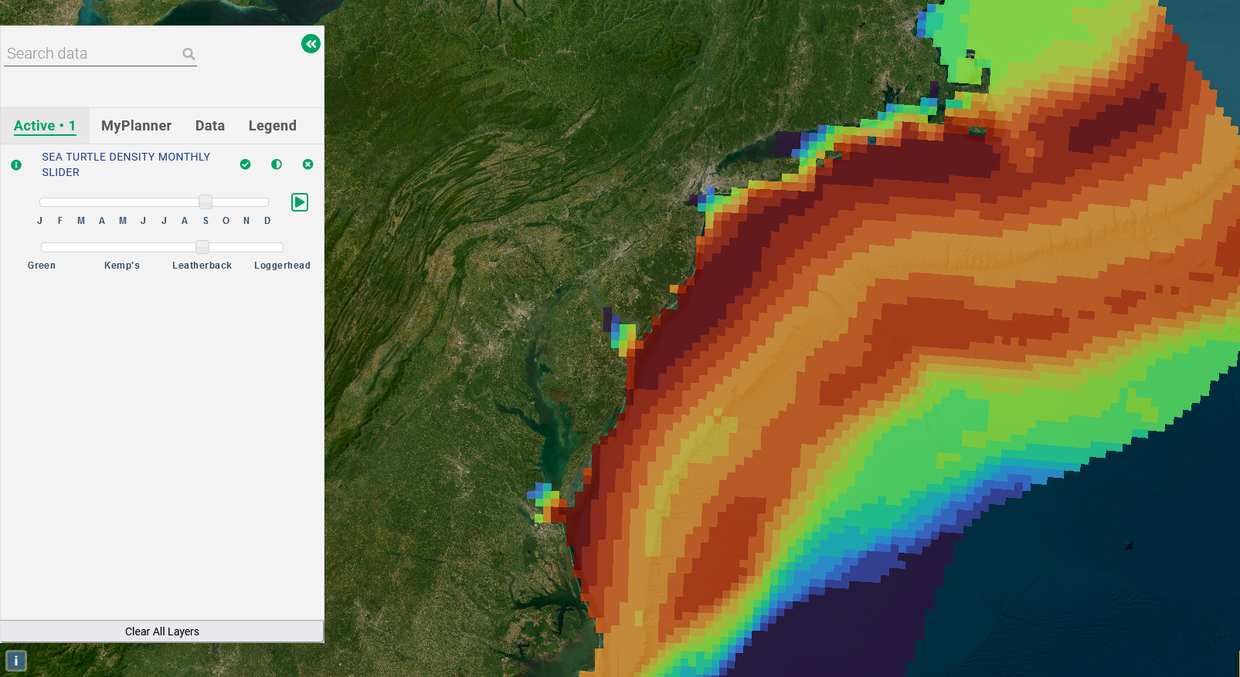
The Portal’s Marine Life theme also carries 60 additional maps showing the distributions of sea turtle species in the Mid-Atlantic. With the recently released Sea Turtle Density Monthly Slider, users can manually toggle through or automatically animate monthly models of green, Kemp’s ridley, leatherback and loggerhead sea turtle distributions in Atlantic waters. The maps were produced through a collaboration of the Marine-life Data & Analysis Team (MDAT), the Northeast Ocean Data Portal and MARCO Portal with data developed by the Navy Undersea Warfare Center Division Newport and several other research institutions. Click here for further details.
The Portal’s Tagged Loggerhead Sea Turtle Density Monthly Slider shows the monthly densities of tagged loggerhead sea turtles throughout Southern New England and the Mid-Atlantic Bight. The map layers represent data from 271 satellite tags deployed on large juvenile and adult loggerheads in the northwest Atlantic by six tagging programs between 2004 and 2016. Click here for further details.
Marine Mammal Strandings
The sea turtle stranding maps largely mirror a collection of marine mammal stranding maps published on the Portal last year. Those maps also depict standings by species/group (North Atlantic right whales, humpback whales, dolphins, porpoises, seals, other whales, and unidentified marine mammals), season and county from Virginia to Maine from 2000-2020. They were created with data maintained by the NOAA Marine Mammal Health and Stranding Response Program and gathered by members of the U.S. National Marine Mammal Stranding Network. Click here for further details.
Questions?

Have questions about the sea turtle stranding maps or any other data on the Portal? Contact us at portal@midatlanticocean.org.