The Portal’s growing collection of maps depicting water pollution and changes in ocean chemistry are now organized in a new Water Quality theme. Among the data available is a newly added map that provides users a snapshot of the overall health of thousands of waterways in the region and links to Environmental Protection Agency (EPA) reports on their suitability for a range of uses.
In addition to the new EPA ATTAINS Assessment Areas map, the Water Quality theme contains the previously published Acidification Monitoring Locations layers (formerly in the Oceanography theme) and the Offshore Discharge Flow layer (formerly in Maritime). Users can expect to see the Water Quality theme expanded with additional maps in the year ahead.
The EPA ATTAINS Assessment Areas layer allows users to click on water bodies for pop-up windows containing links (shown as “WaterbodyReportLink”) to EPA “How’s My Waterway” reports. These pages may contain information on whether a water body is considered safe for uses such as recreation, fishing or drinking; the nature of any impairments; the status of plans to protect or restore water quality; and much more.
ATTAINS (Assessment, Total Maximum Daily Load Tracking and Implementation System) is an online system for accessing information about the conditions in the nation’s surface waters. The Clean Water Act requires states, territories and authorized tribes to monitor water pollution and report to the EPA on the bodies they have evaluated (a process is called assessment). Part of this process is deciding which waters do not meet water quality standards because they are too polluted. These degraded waters are called impaired (polluted enough to require action) and are placed on a state list for future actions to reduce pollution.
The map shows areas that have been assessed as “polluted” in red and “good” in green. Some significant water bodies that are currently unassessed are shown in purple. The impairment levels as shown are dependent on each state's water quality status reporting, which differs from state to state.
Note on New Jersey’s Representation
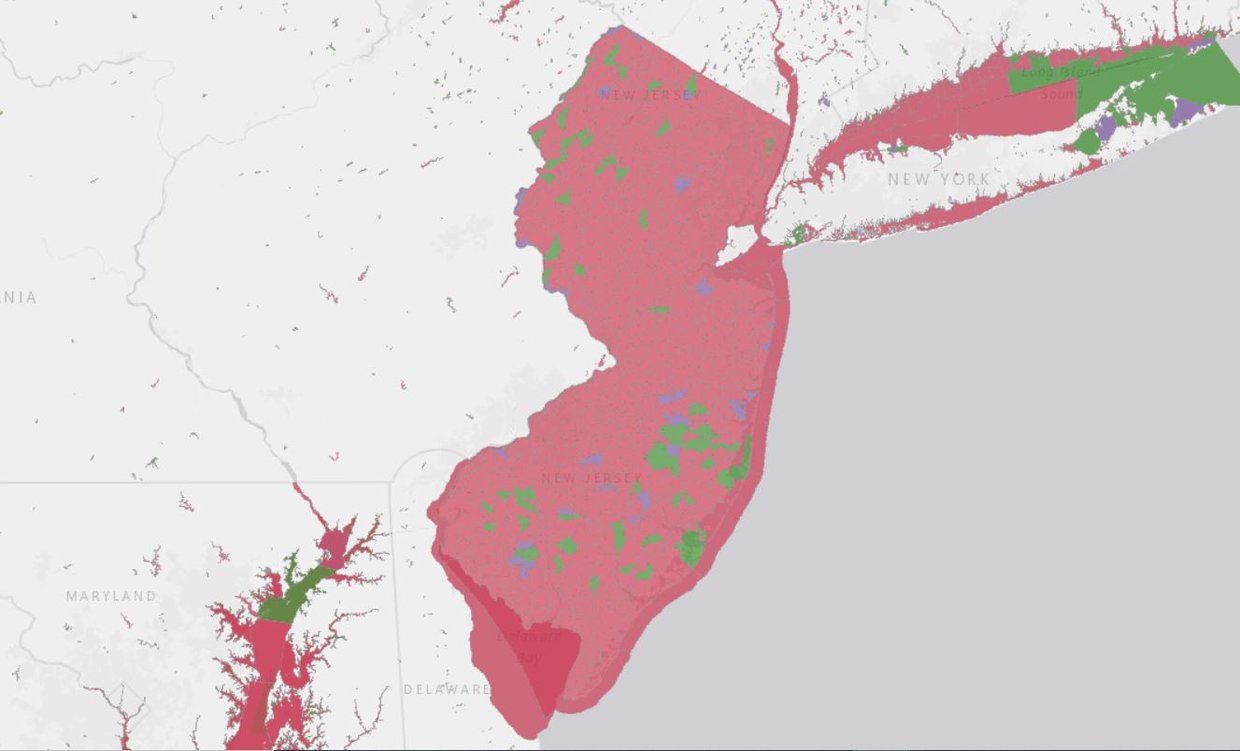
New Jersey’s land area is fully covered in this map due to a difference in the state’s reporting methodology. Where assessments in other states are confined to water bodies and their respective sub-delineations, New Jersey’s include the watershed boundaries which surround each assessed water body.